

Services
ML and Enterprise Forecasting
Forecasts your planners can question, with the drivers behind every number and what-if answers in plain English.
What we forecast
We build the data, the evals and the governance once.
The questions change from one business to the next. The data, the evaluation and the governance do not, so every forecast after the first one reuses them.
A few of the models we’ve built
- 01
Demand Forecasting
Orders, units and revenue by product, site and channel, from next week to next year.
- 02
Prices and margins
How demand responds to price, and what a price change or promotion does to margin.
- 03
Churn and customer value
Which customers are drifting away, what they are worth, and the offer that would keep them.
- 04
Parts and supply
Spare parts, materials and supplier lead times, feeding straight into maintenance and purchasing plans.
- 05
Production
Output and decline by well, plant or line, and the emissions that come with it.
- 06
Equipment failure
Which assets are likely to fail and when, so maintenance happens before the breakdown.
Predictive and generative AI
Planners can ask why a number moved, and the answer has to come from the forecast model.
Predictive models learn from history and return a forecast. They cannot read a supplier notice or write the weekly review. A language model can do both, and it is not allowed to invent a figure. Every number it quotes comes from the forecast model, with the model version and its assumptions attached.
-
1
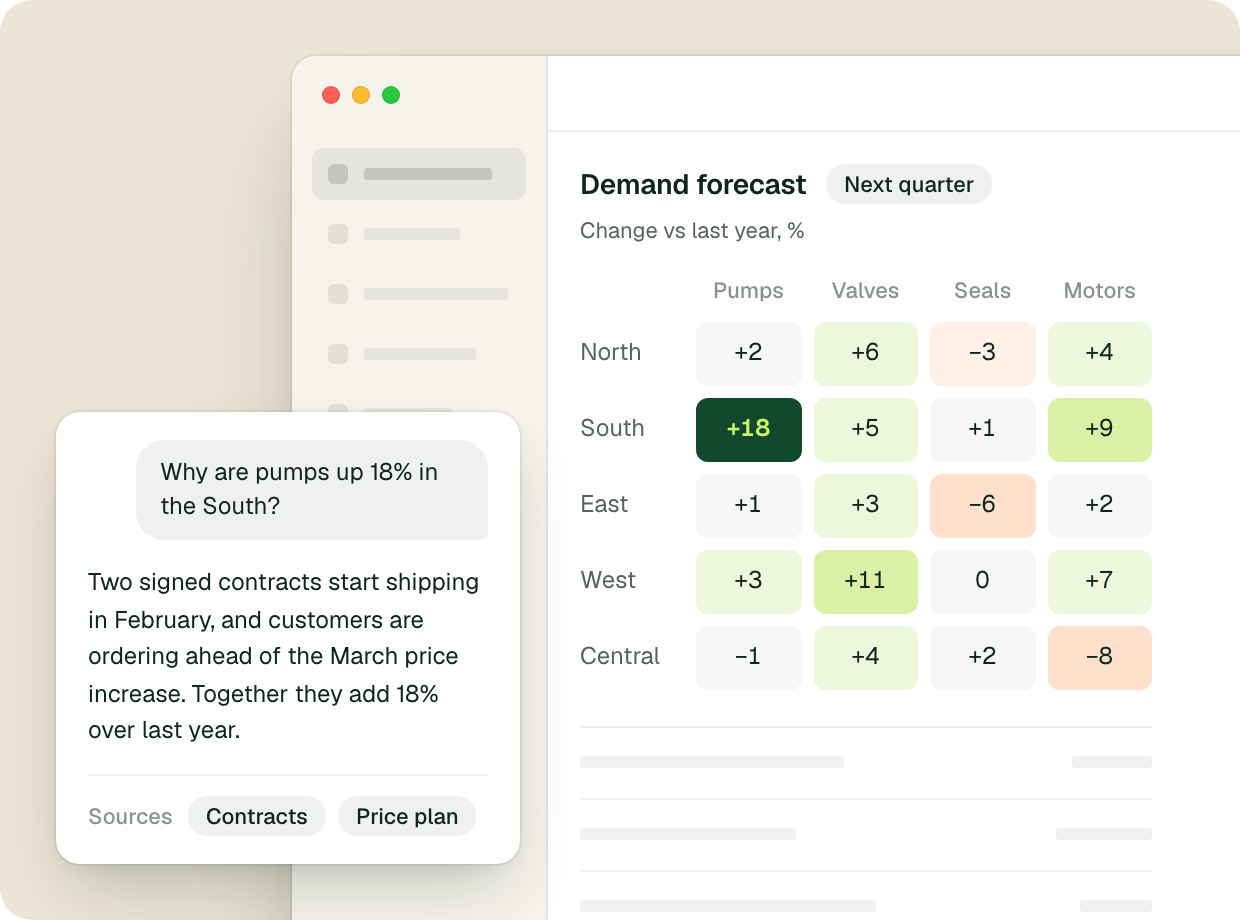
Text becomes signals the model can use
Language models read sales notes, supplier notices and news, and turn them into dated signals. Each one has to earn its place in a backtest, the same way a price or a promotion does. A signal that shows no lift stays out.
-
2
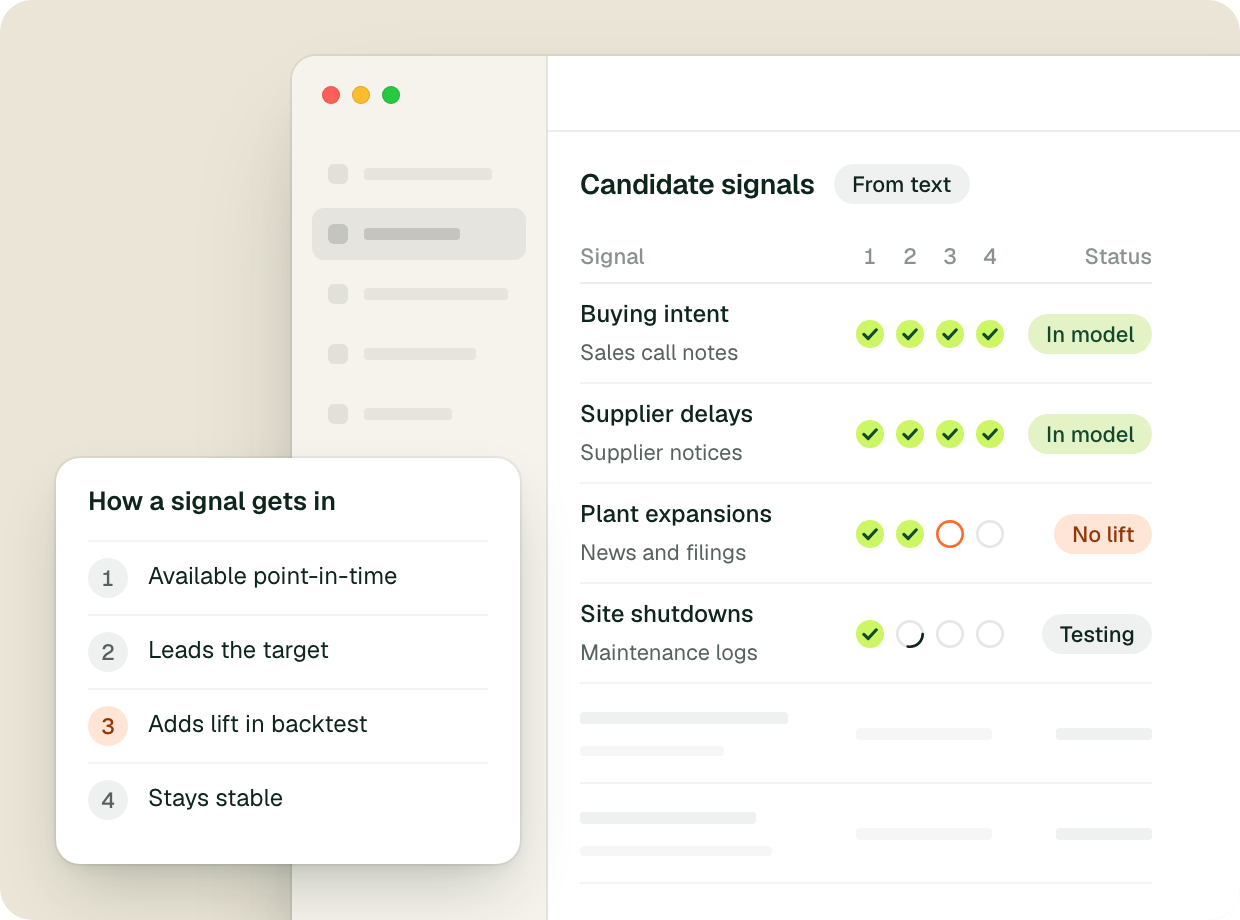
Every change is broken into its drivers
Shapley values split each forecast into what moved it, and the summary for the weekly review is written from those values. The language model is only allowed to quote the forecast model.
-
3
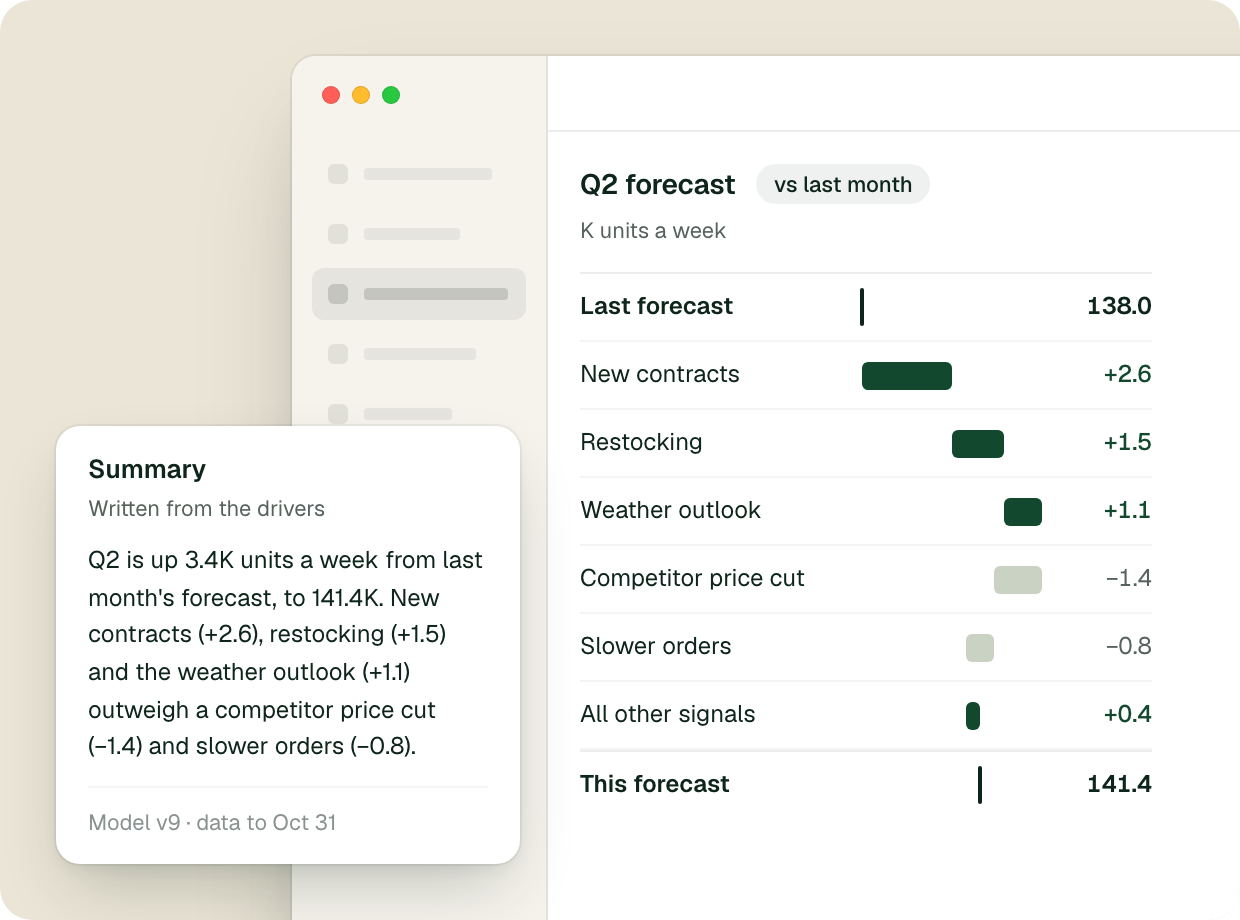
Planners ask what-if questions in plain English
The question becomes model inputs and the model runs again. The answer comes back with its range, next to the base case.
-
4
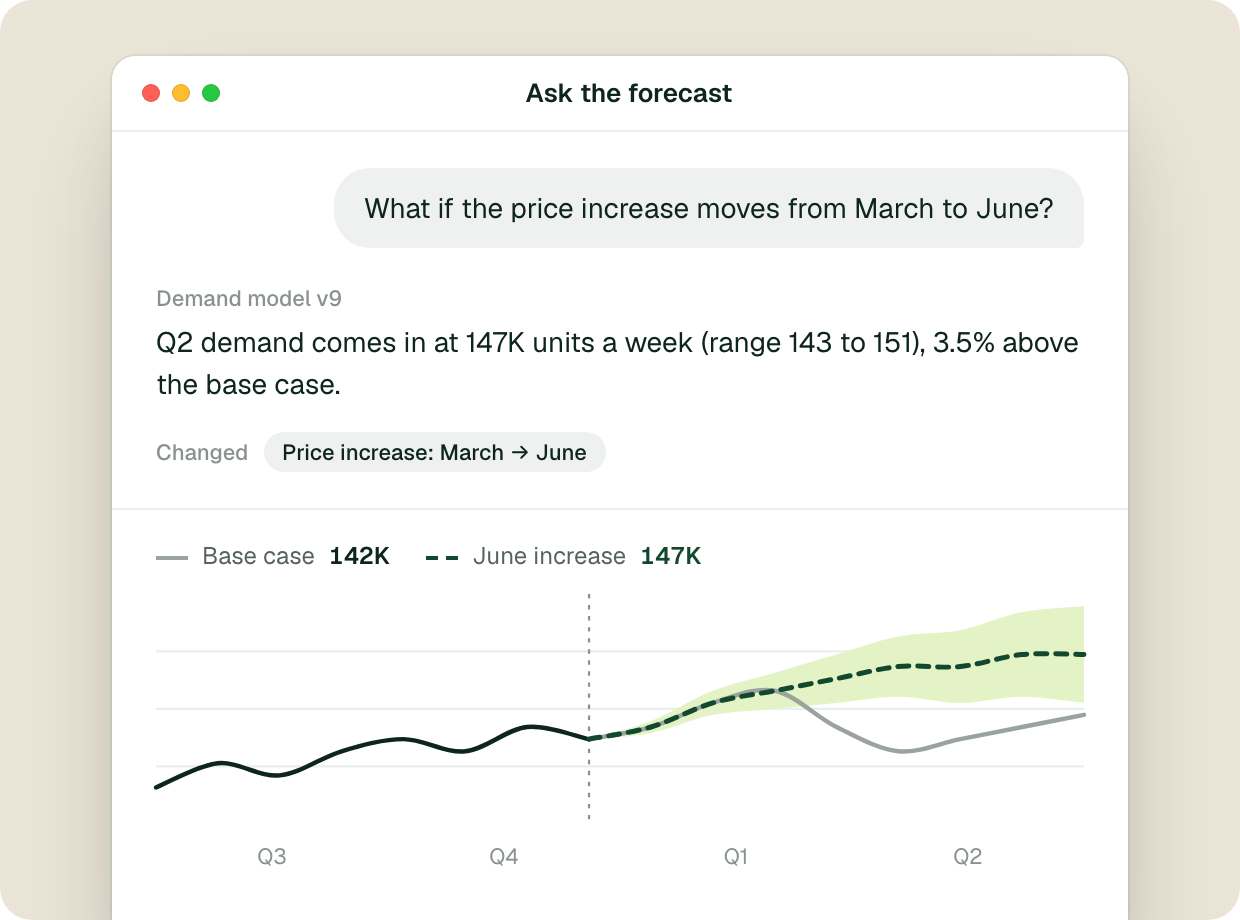
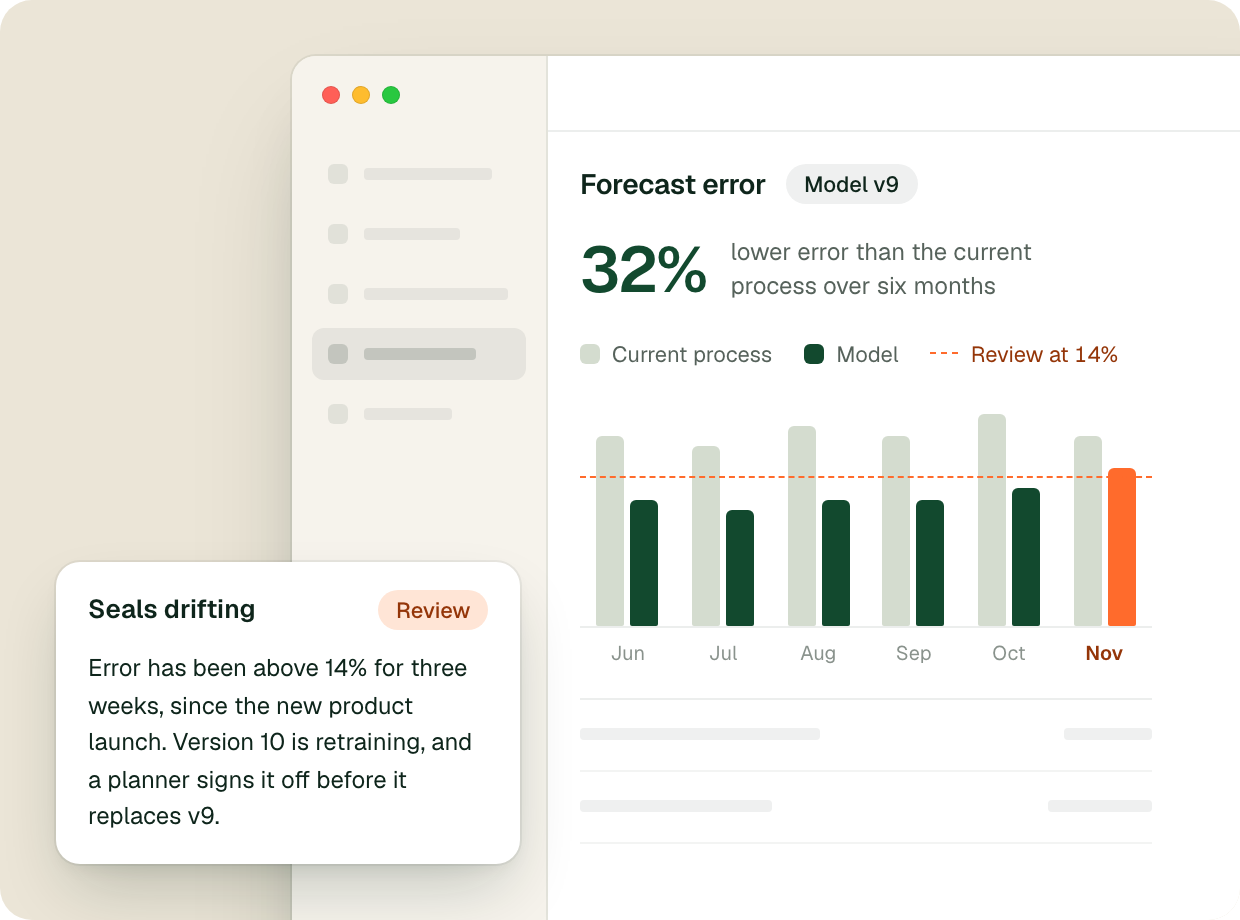
Every model is measured against today’s process
Error is reported every period as lift over the process the model replaced. When accuracy drifts, the model is flagged and retrained, and a planner signs off before the new version goes live.
Built to be trusted
Six controls ship in the first release.
Forecasts drive orders, staffing, budgets and prices. Every model we ship carries these six controls from the first release, because a number that reaches an order cannot be explained after the fact.
Reasons behind every forecast
Shapley values show which drivers moved each prediction, and by how much.
Figures only from the model
Language models answer from approved documents and data, cite their sources, and quote numbers only from the model.
Agents act within limits
Agents work inside agreed limits and log every step. Bigger changes need approval.
A person signs off
Planners approve changes above the thresholds you set, before they reach orders, rosters or prices.
Drift caught early
New products, demand shifts and changes in the data trigger review and retraining.
Inside your environment
Deployed on your infrastructure, with your privacy and access rules built in.
How the work runs
A forecast ships only if it beats the process it replaces.
- 01Baseline and prioritize
Score candidate forecasts on value, data readiness and risk, and measure today’s process so every gain is counted against it.
- 02Assemble data
Point-in-time features from the systems you already run, built in your data platform.
- 03Build
Predictive models, language model components and agents, chosen by backtest and evaluation.
- 04Validate
Backtests, live runs beside the current process and evaluation sets, reviewed with the people who plan.
- 05Deploy and explain
Monitoring, retraining, drivers and plain-language summaries in the tools your team already uses.
Most work starts with a four-week pilot: one forecast for one business unit or region, scored against today’s process on historical data. Production follows in months two to four, and the next forecasts reuse the same data, evaluation and governance foundation. Everything is built in Python inside your data platform, and the code, pipelines and evaluation harness are yours at the end.
Case studies
Where we’ve put it to work.
Other services
Seven more ways we put AI to work.
- AI TransformationWe write your AI roadmap, build it, and hand it to your team.
- AI SDLCOne agent-ready flow from idea to merged code, scaled team by team.
- AI for GTM & FinanceA data foundation for go-to-market and finance, then the agents that run on it.
- Fine-tuning and EvalsModels tuned to your data, and the evaluations that prove they work.
- AI Cost OptimizationSeeing where AI spend goes and bringing it down without losing quality.
- Custom Agent and App DevelopmentAgents and AI applications built for one workflow and run in production.
- Context and Knowledge GraphsTurning what your company knows into context your AI systems can use.